


Blogs
Electromagnetic Simulation of Antenna Performance Solid-State Microwaves
INTRODUCTION
The advent of high-power solid-state microwave technology makes possible the use of coaxial transmission lines and unconventional antenna configurations, something not previously possible when using magnetrons at ISM frequencies without expensive, lossy waveguide-to-coaxial adapters. With this in mind, computer simulations of microwave heating models can serve as valuable tools in the development and control of novel microwave heating processes, as well as the design of new microwave applicators [1]. It is widely accepted that using simulations to optimize applicator configuration can significantly reduce the time and cost associated with developing a new process, and this optimization includes determining which type of antenna is most appropriate for a given application [2]. For this study, the simulation includes a generic lossy load placed in a rectangular cavity that is designed for use at S-band frequencies, with 1kW of energy applied from one of three antenna types: a WR340 waveguide feed, a quarter-wave monopole antenna, and a half-wave dipole antenna. COMSOL Multiphysics was used to model the coupling between the electromagnetic and thermal physics.
VIRTUAL PROCESS OPTIMIZATION
Factors that affect the power density distribution and temperature profile of a microwave heating process include material sample size, sample location inside the applicator, operating frequency, applied power, applicator geometry, type of antenna used, and antenna orientation [3]. Controlling for these variables allows a direct comparison of how different antennas behave within the system. Parameters to consider when deciding which antenna is most appropriate for a given application include efficiency, heating uniformity in the load, power handling capabilities, antenna bandwidth, and cost. Antenna bandwidth is particularly important due to the frequency-agile nature of solid-state transmitters. By using computer simulations to analyze changes in the absorbed energy, power density distribution and heating profile across the frequency band, it is possible to determine the optimal configuration of the microwave applicator, including any frequencies within the operating band that should be avoided due high return loss.
RESULTS
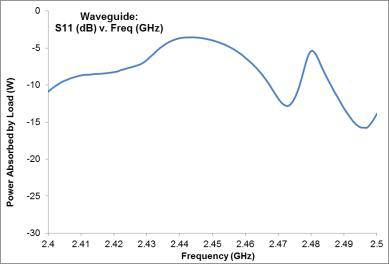
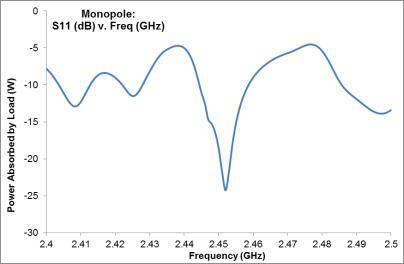
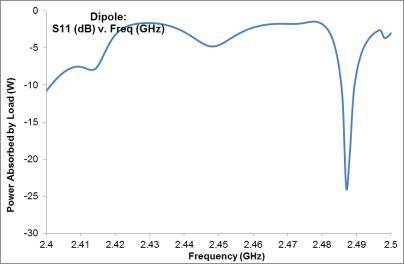
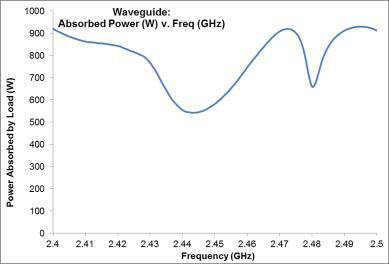
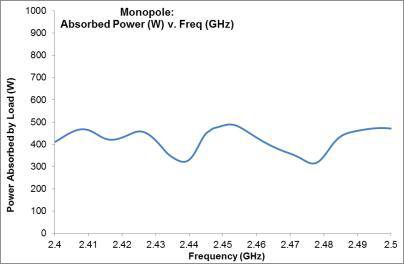
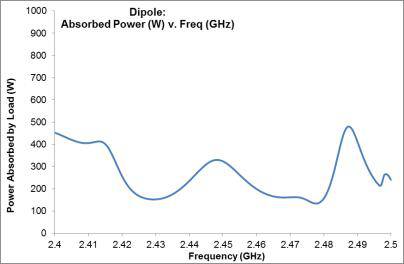
Figure 1: TOP: Plot of S11 vs. Frequency for waveguide, monopole, and dipole feeds. BOTTOM: Plot of absorbed power vs. Frequency for waveguide, monopole, and dipole feeds.
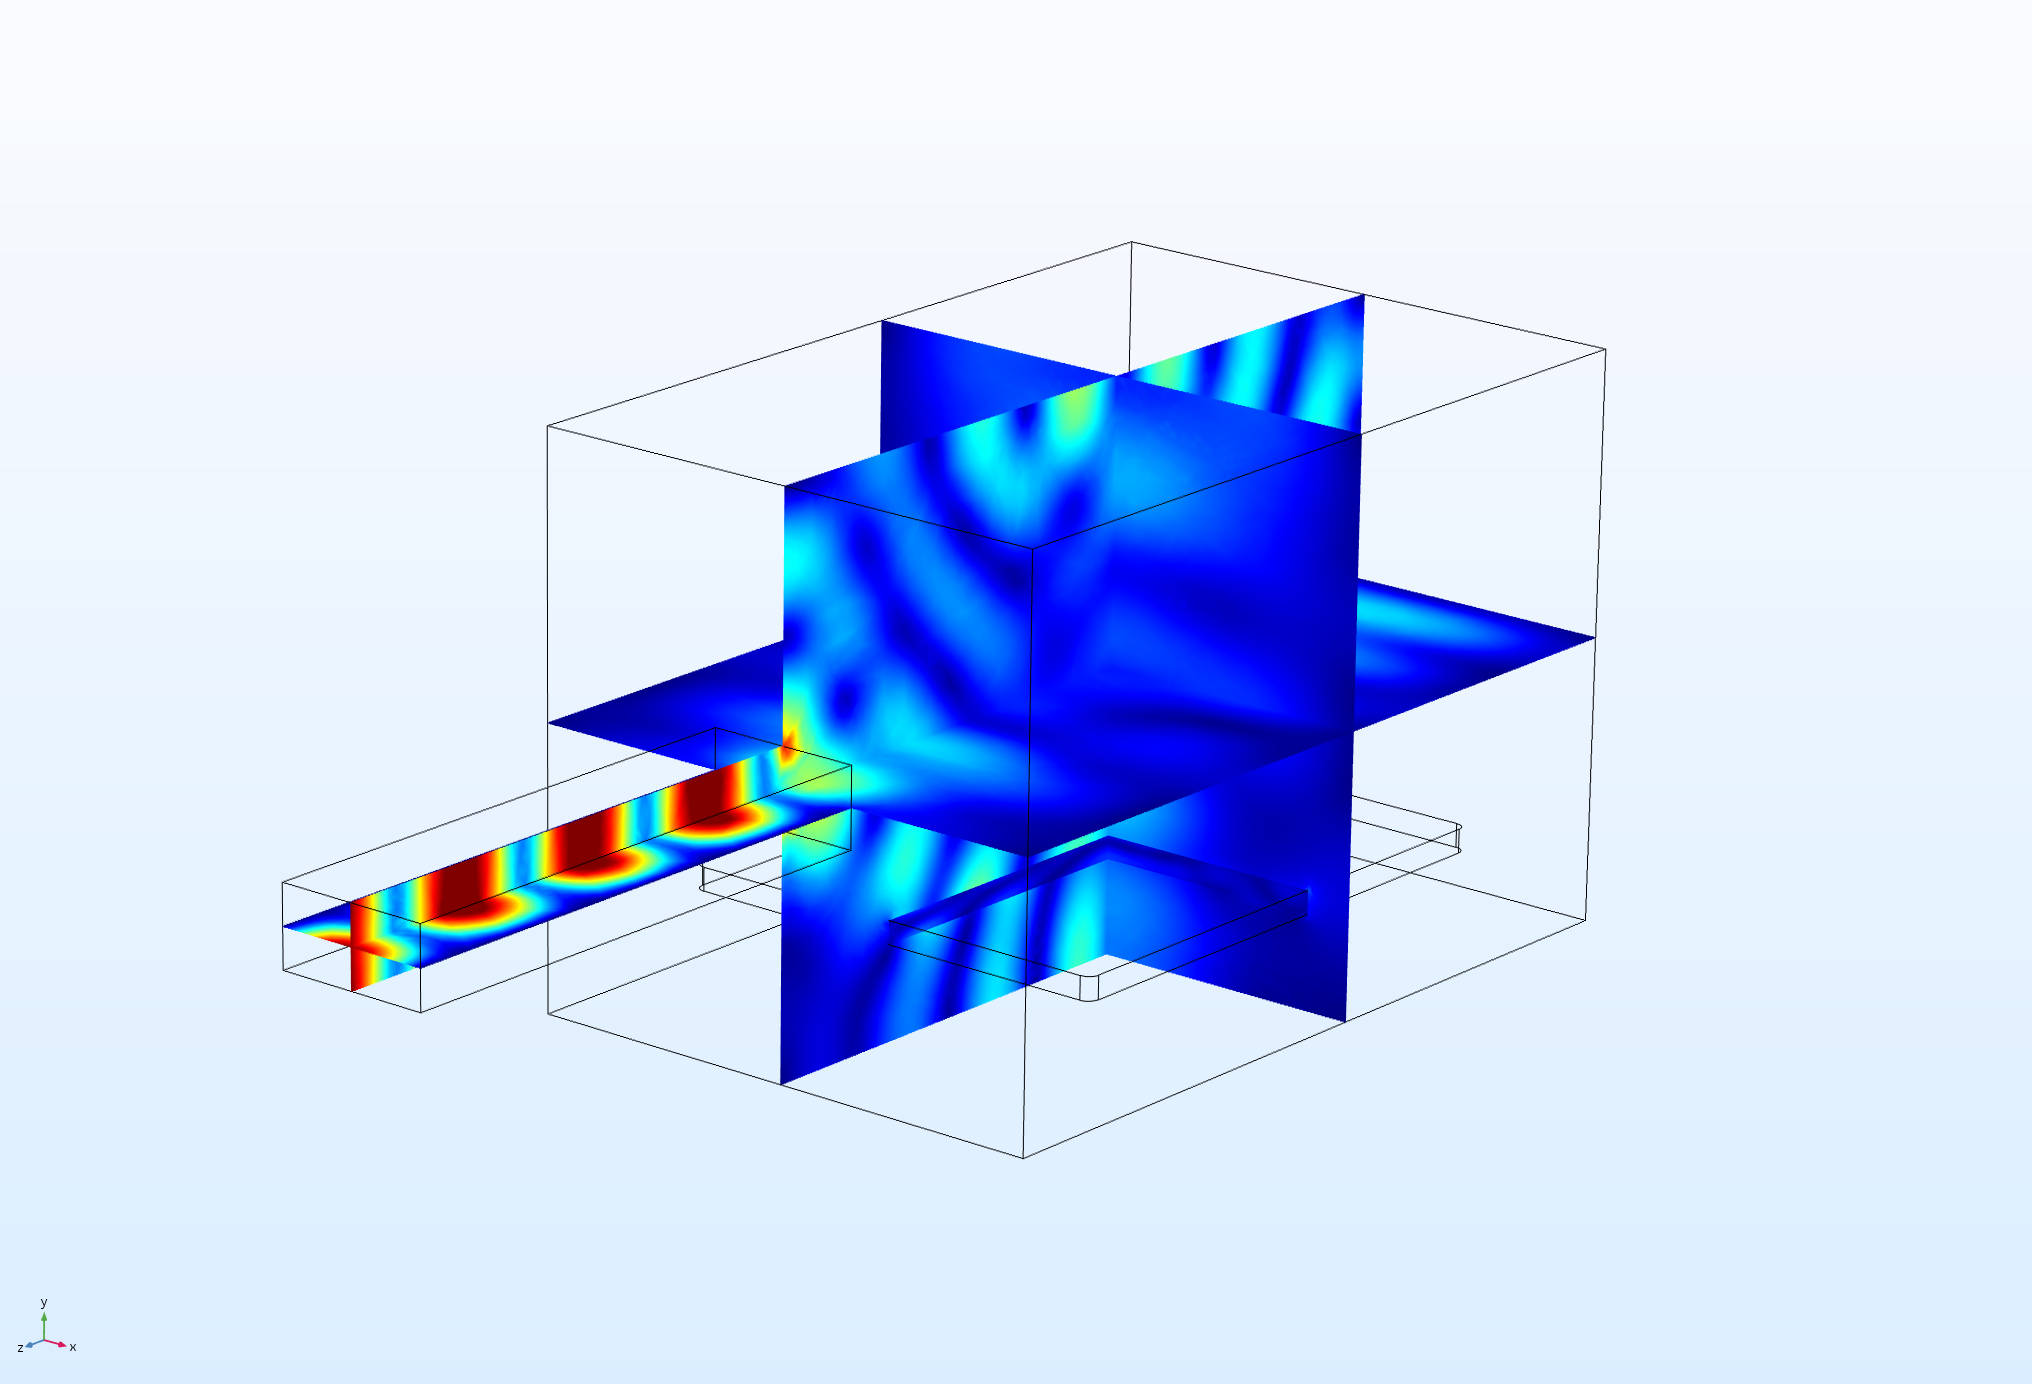
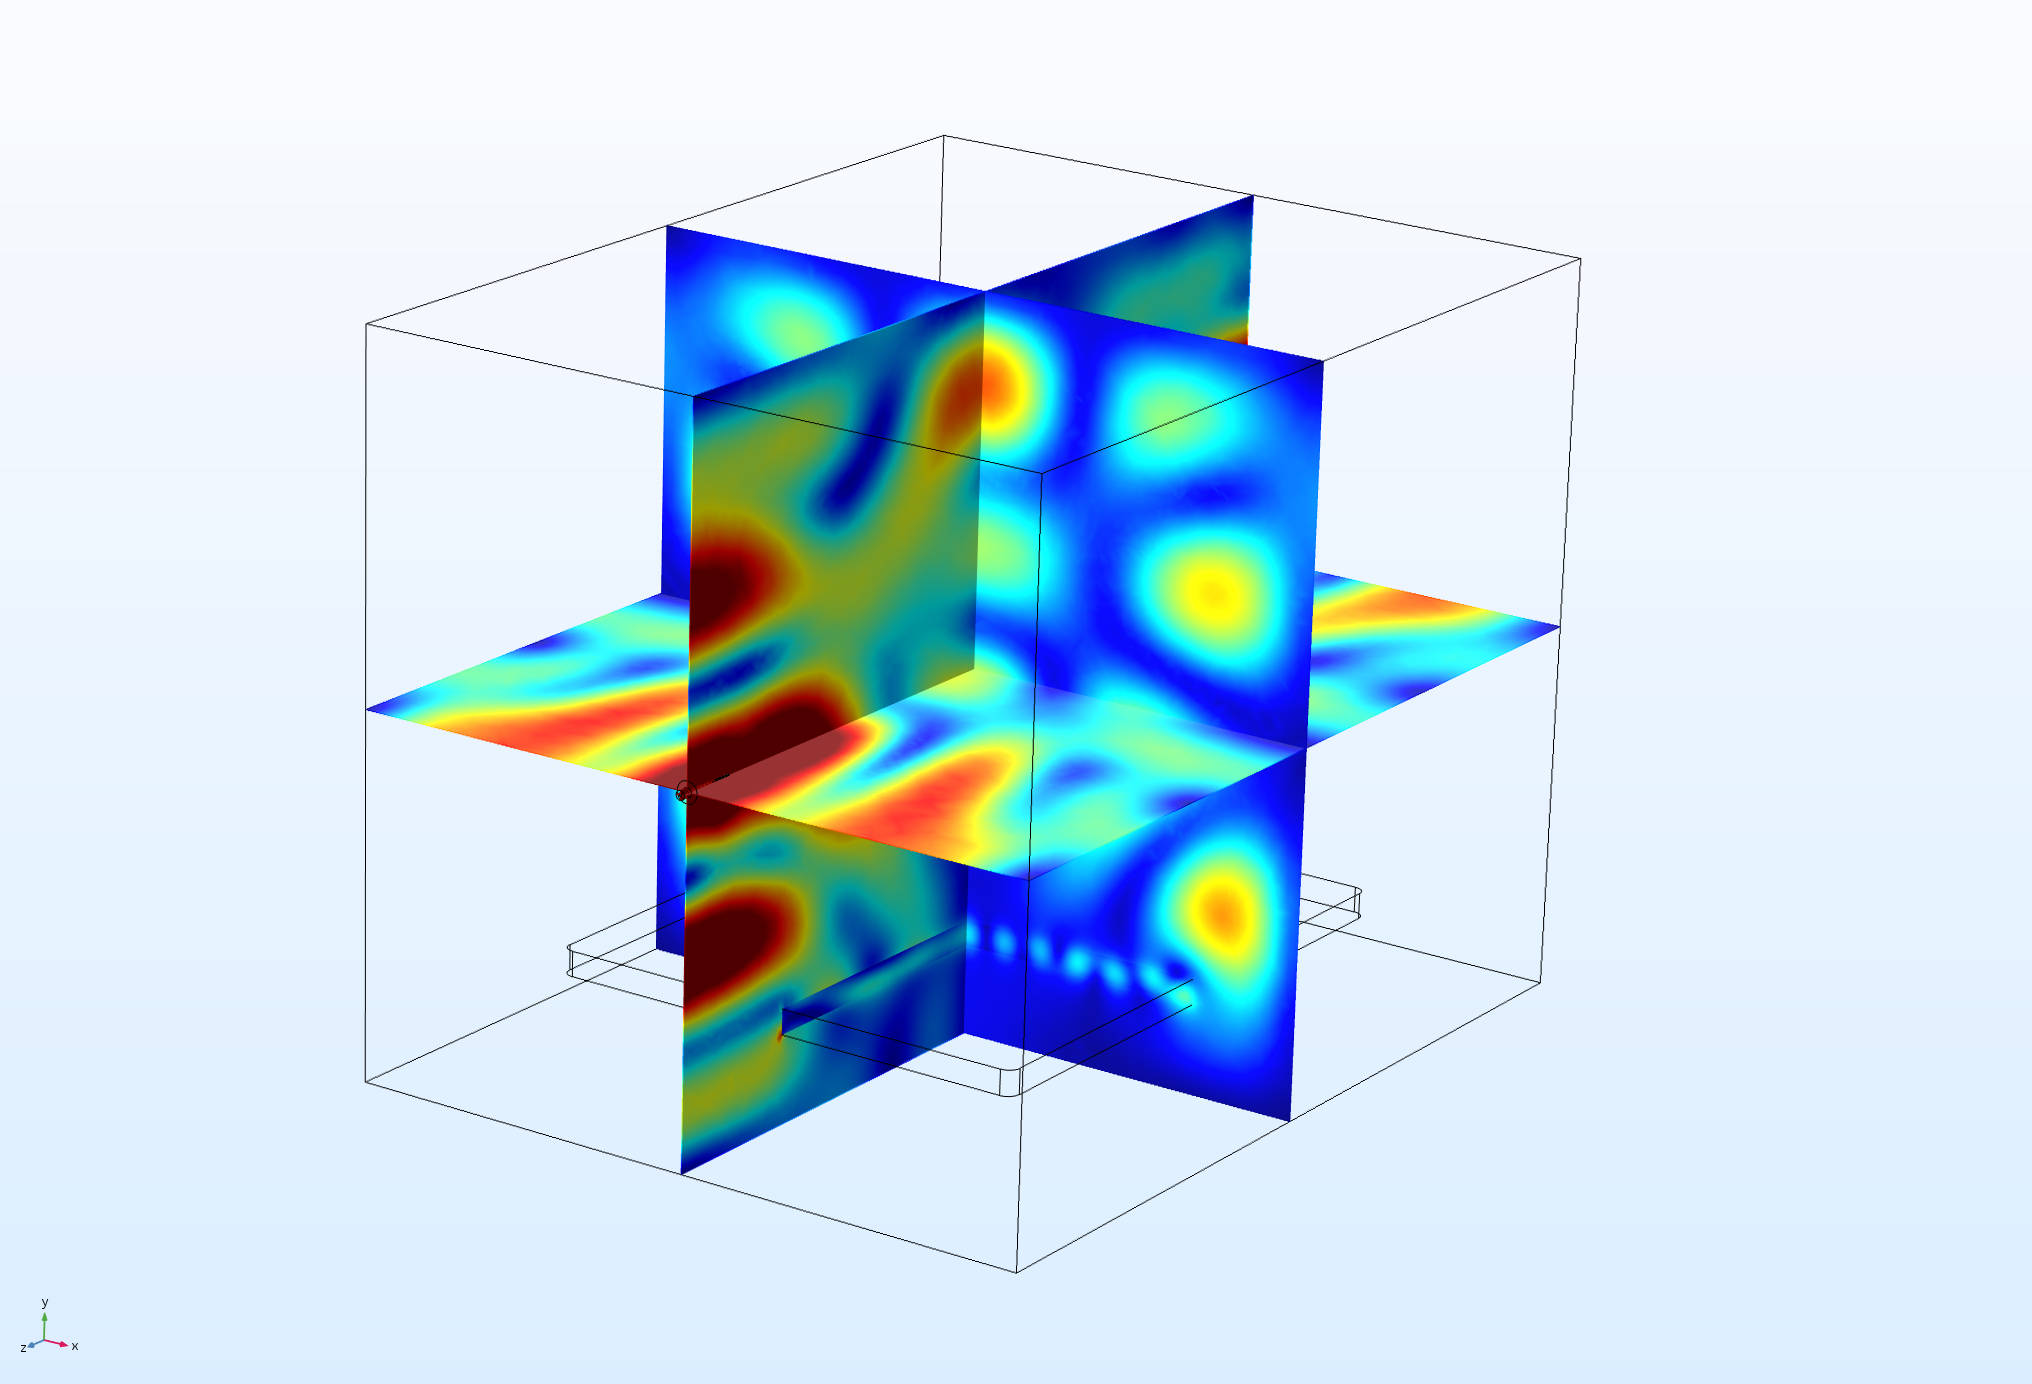
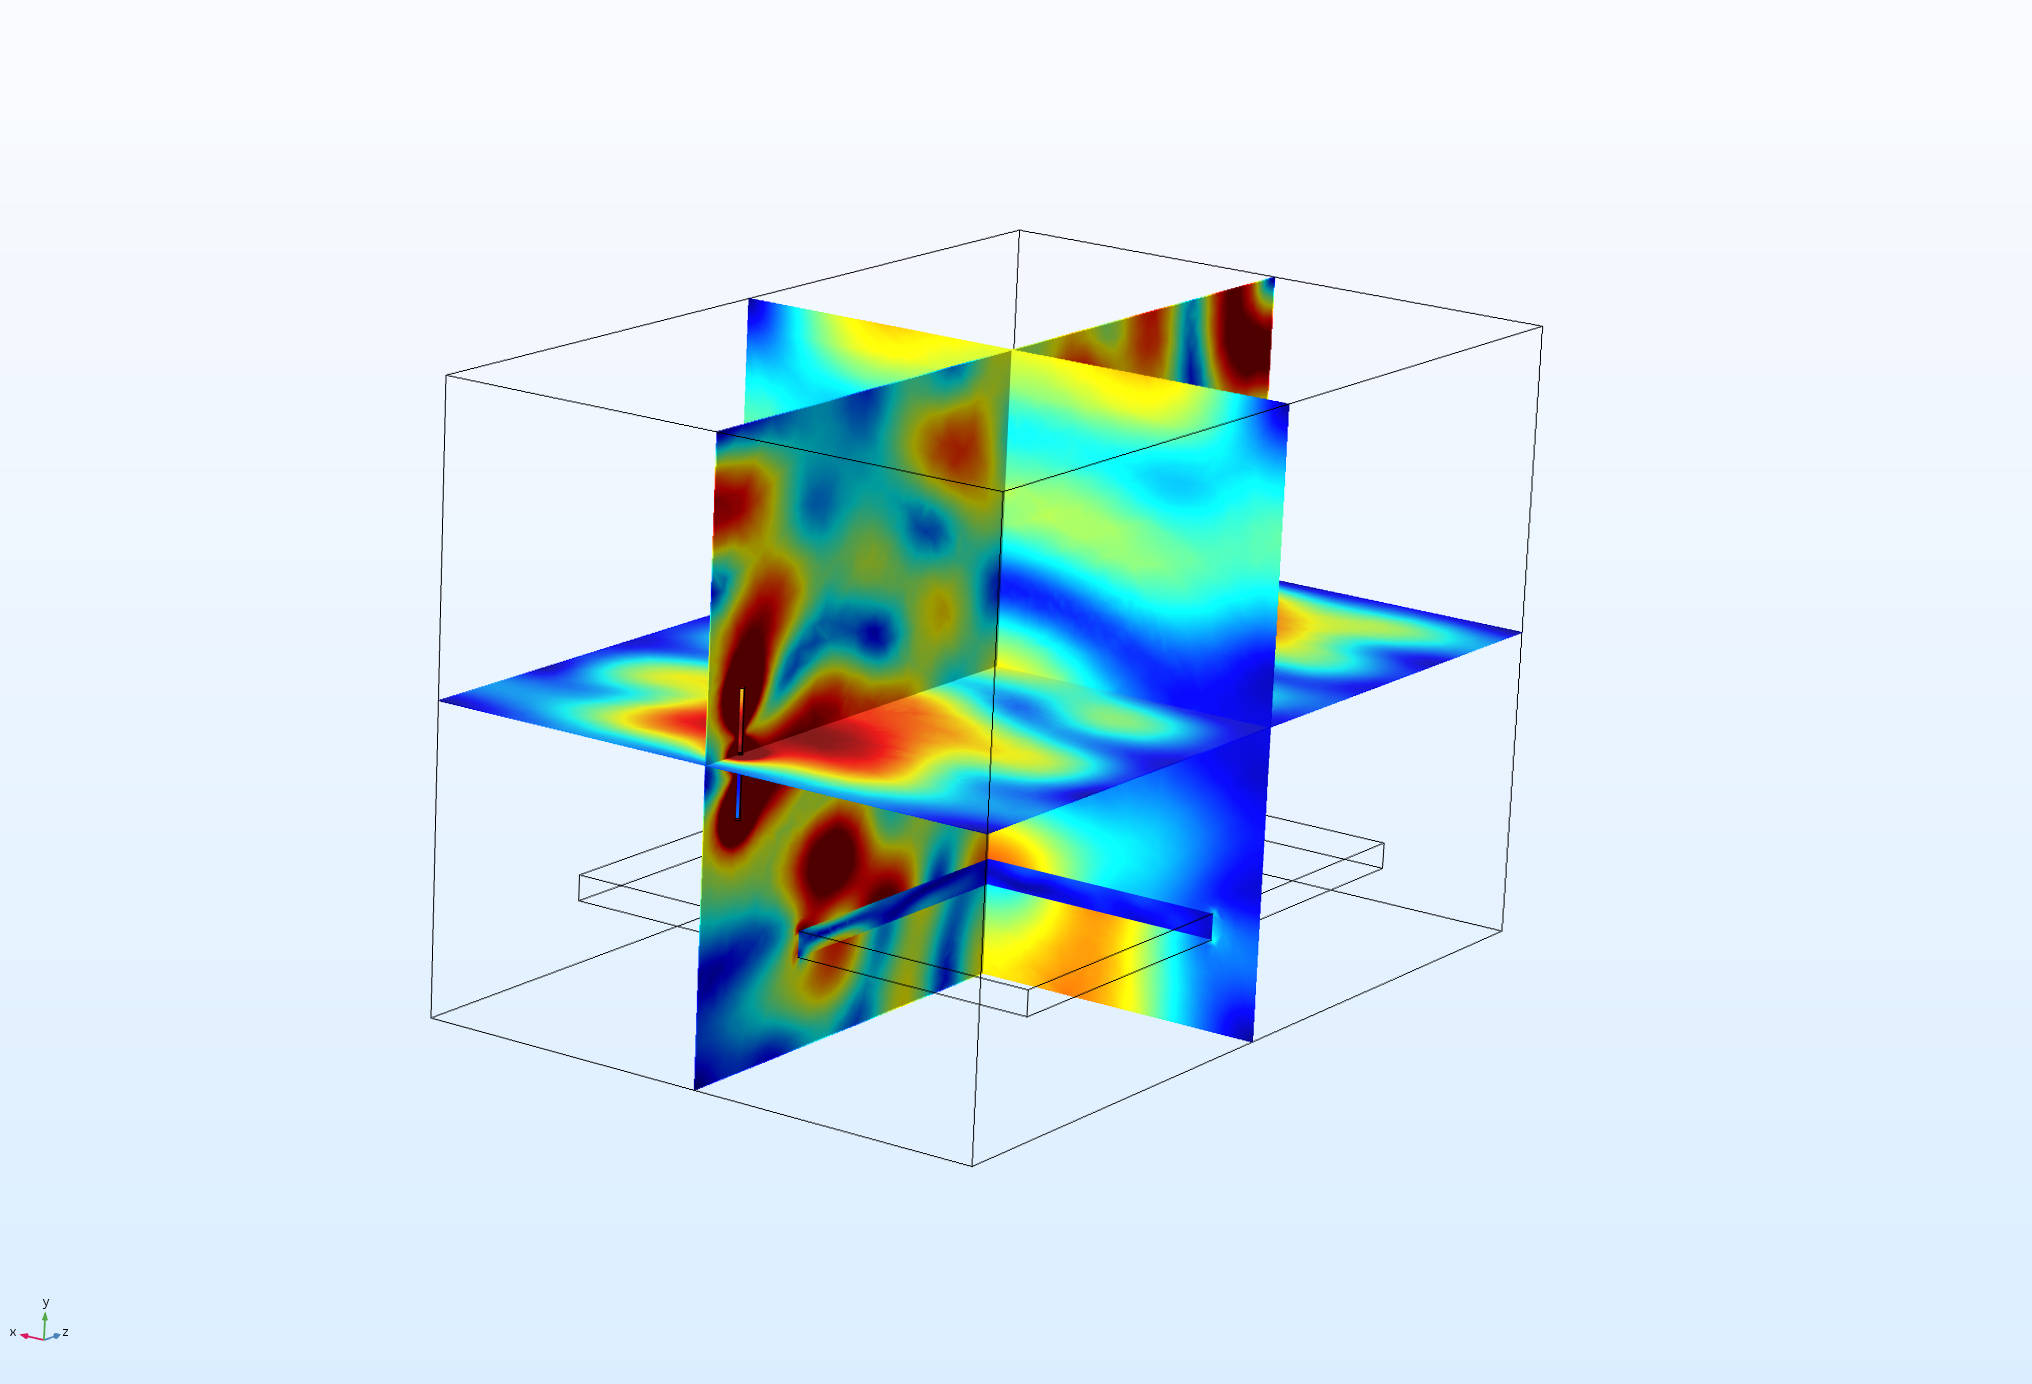
Figure 2: Electromagnetic fields inside microwave cavities excited by (left to right) WR340 waveguide, 1/4λ monopole antenna, and 1/4λ dipole antenna. Results shown are at 2.450GHz.
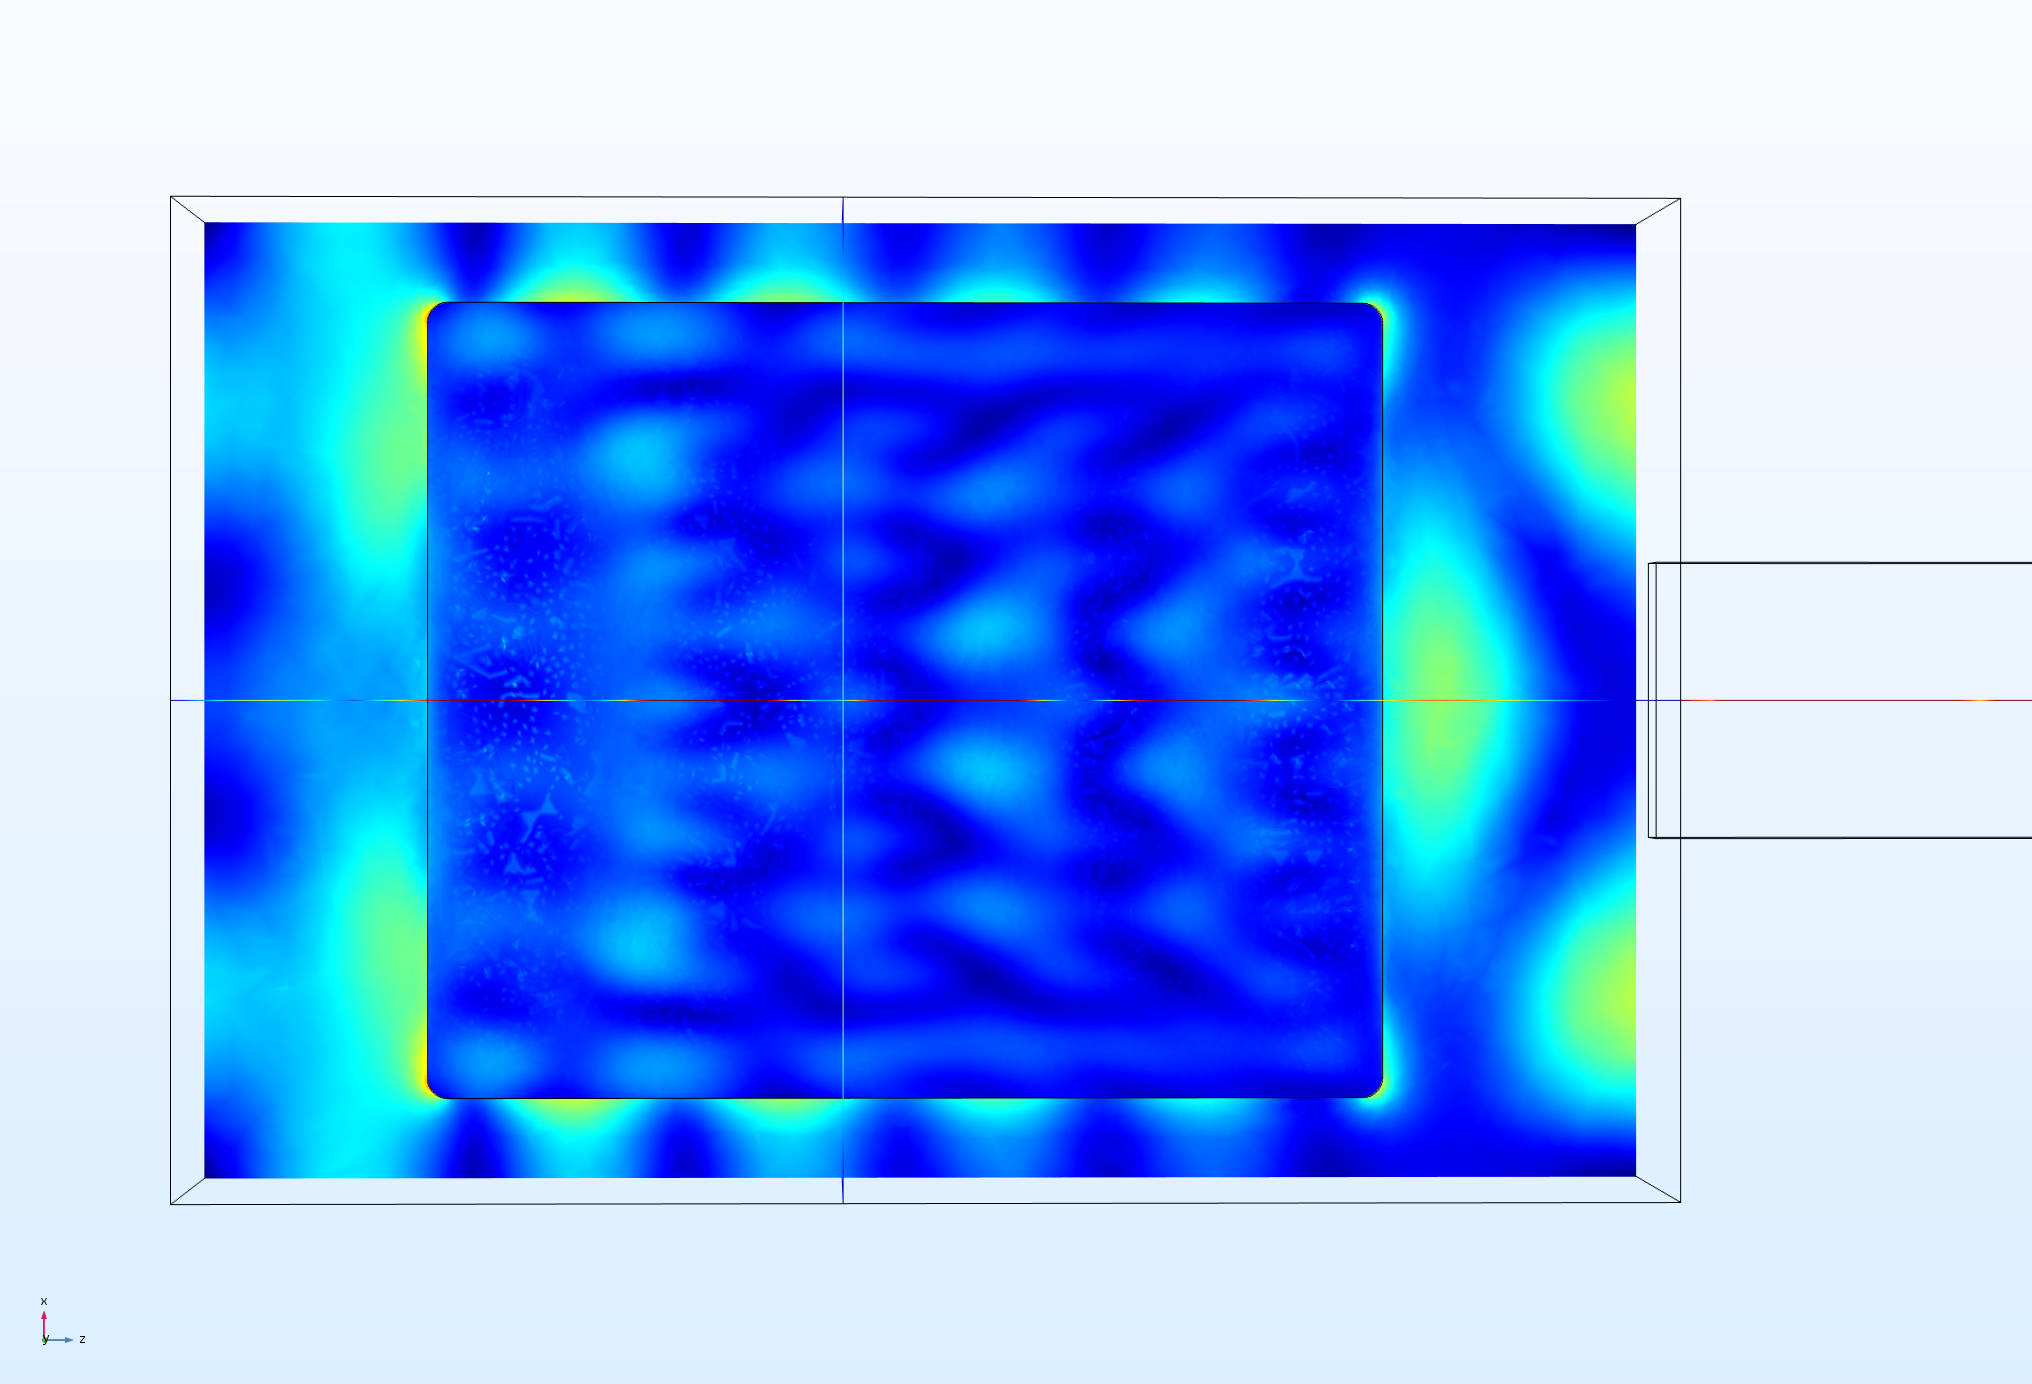
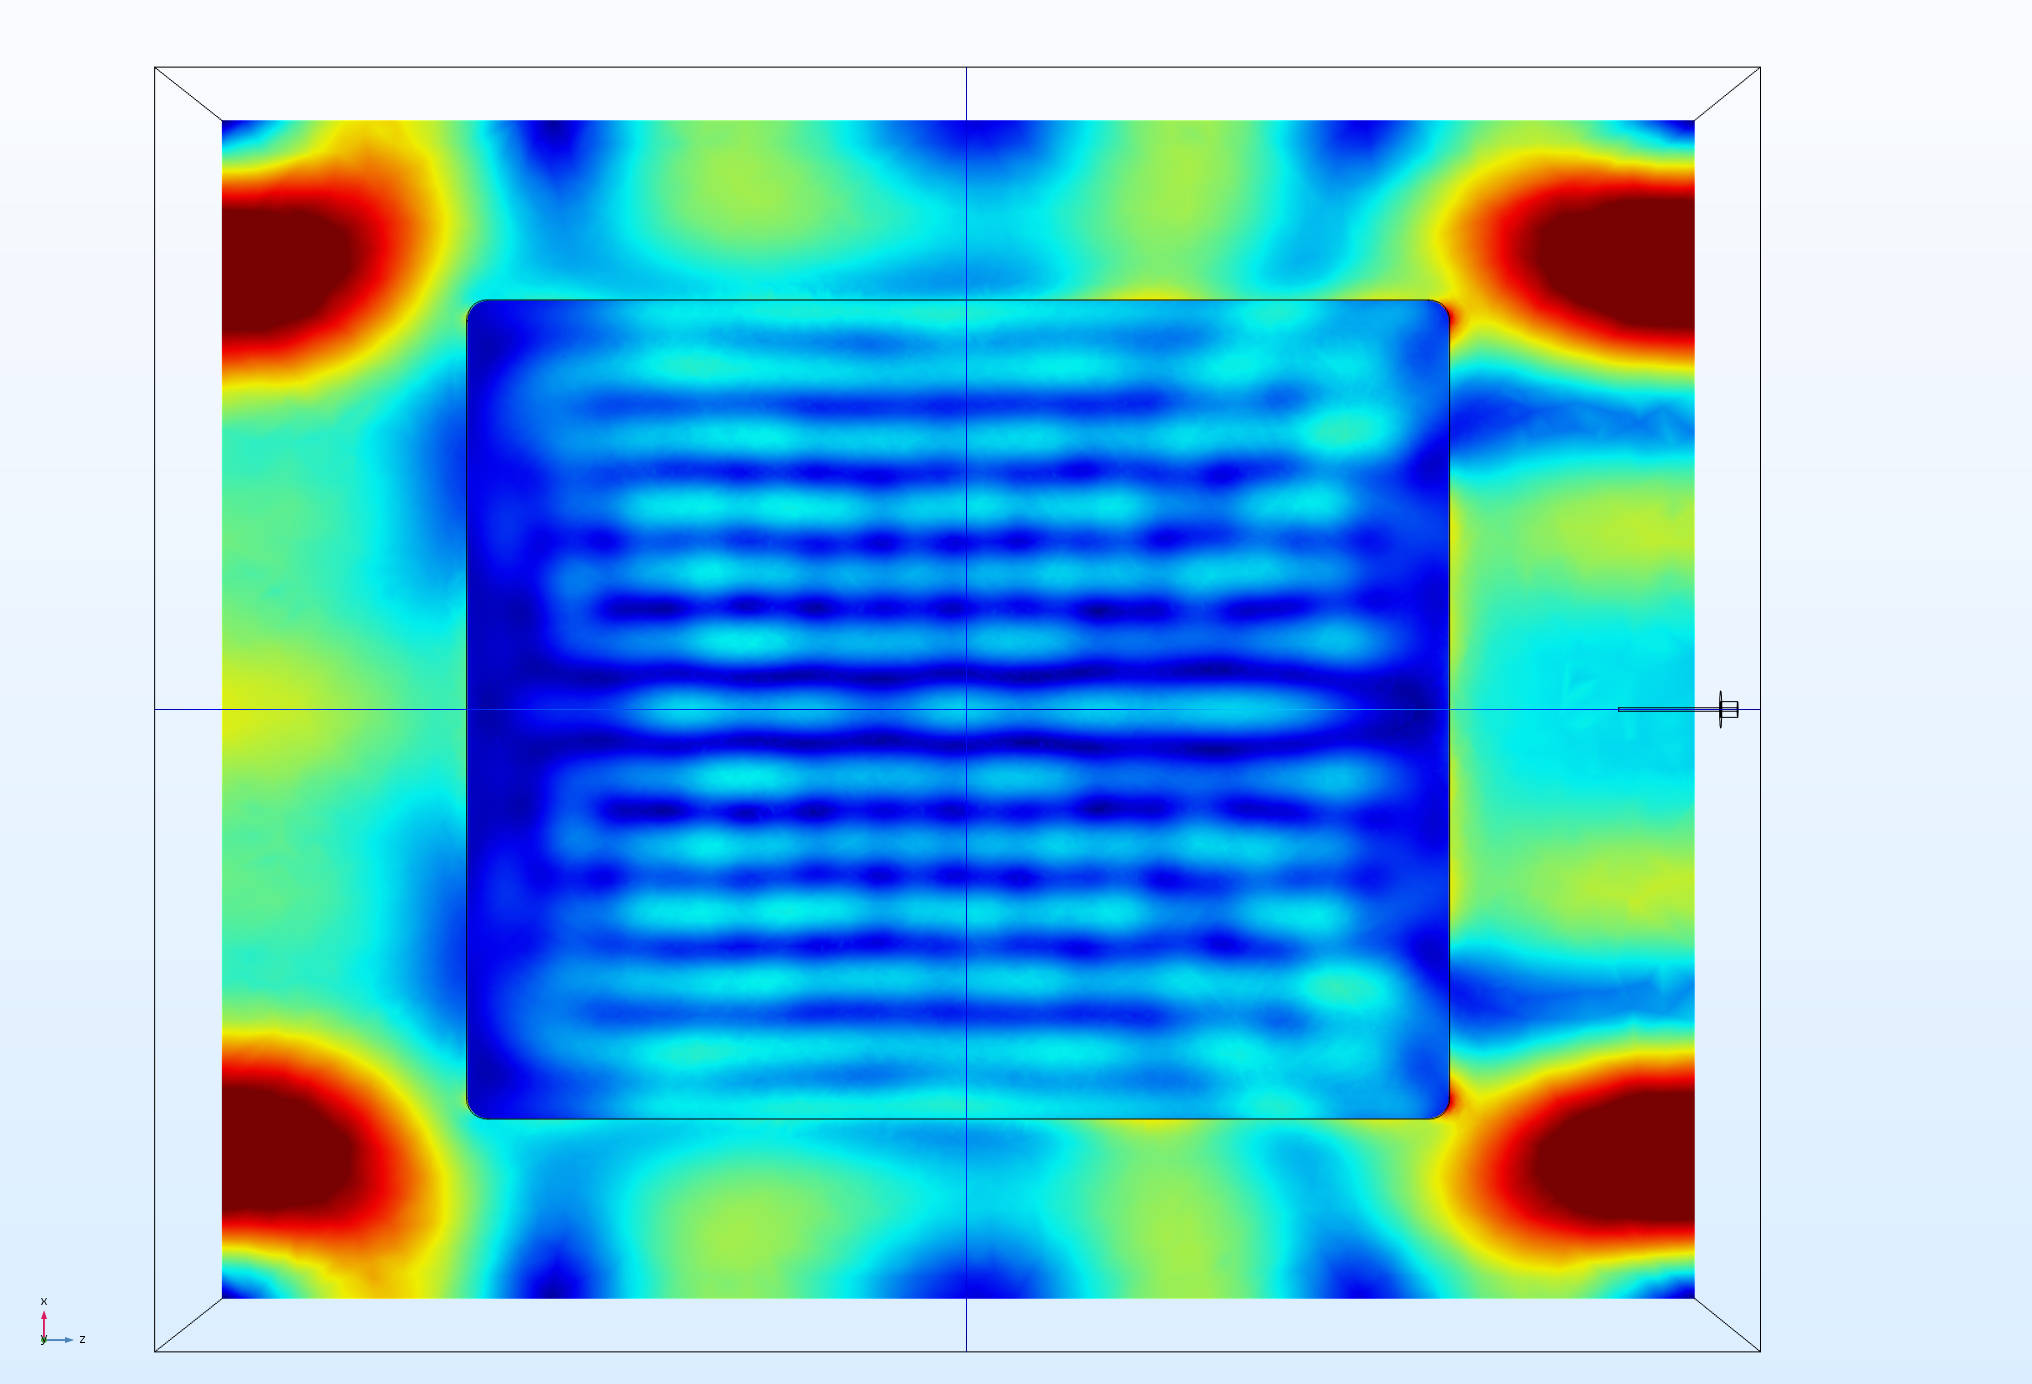
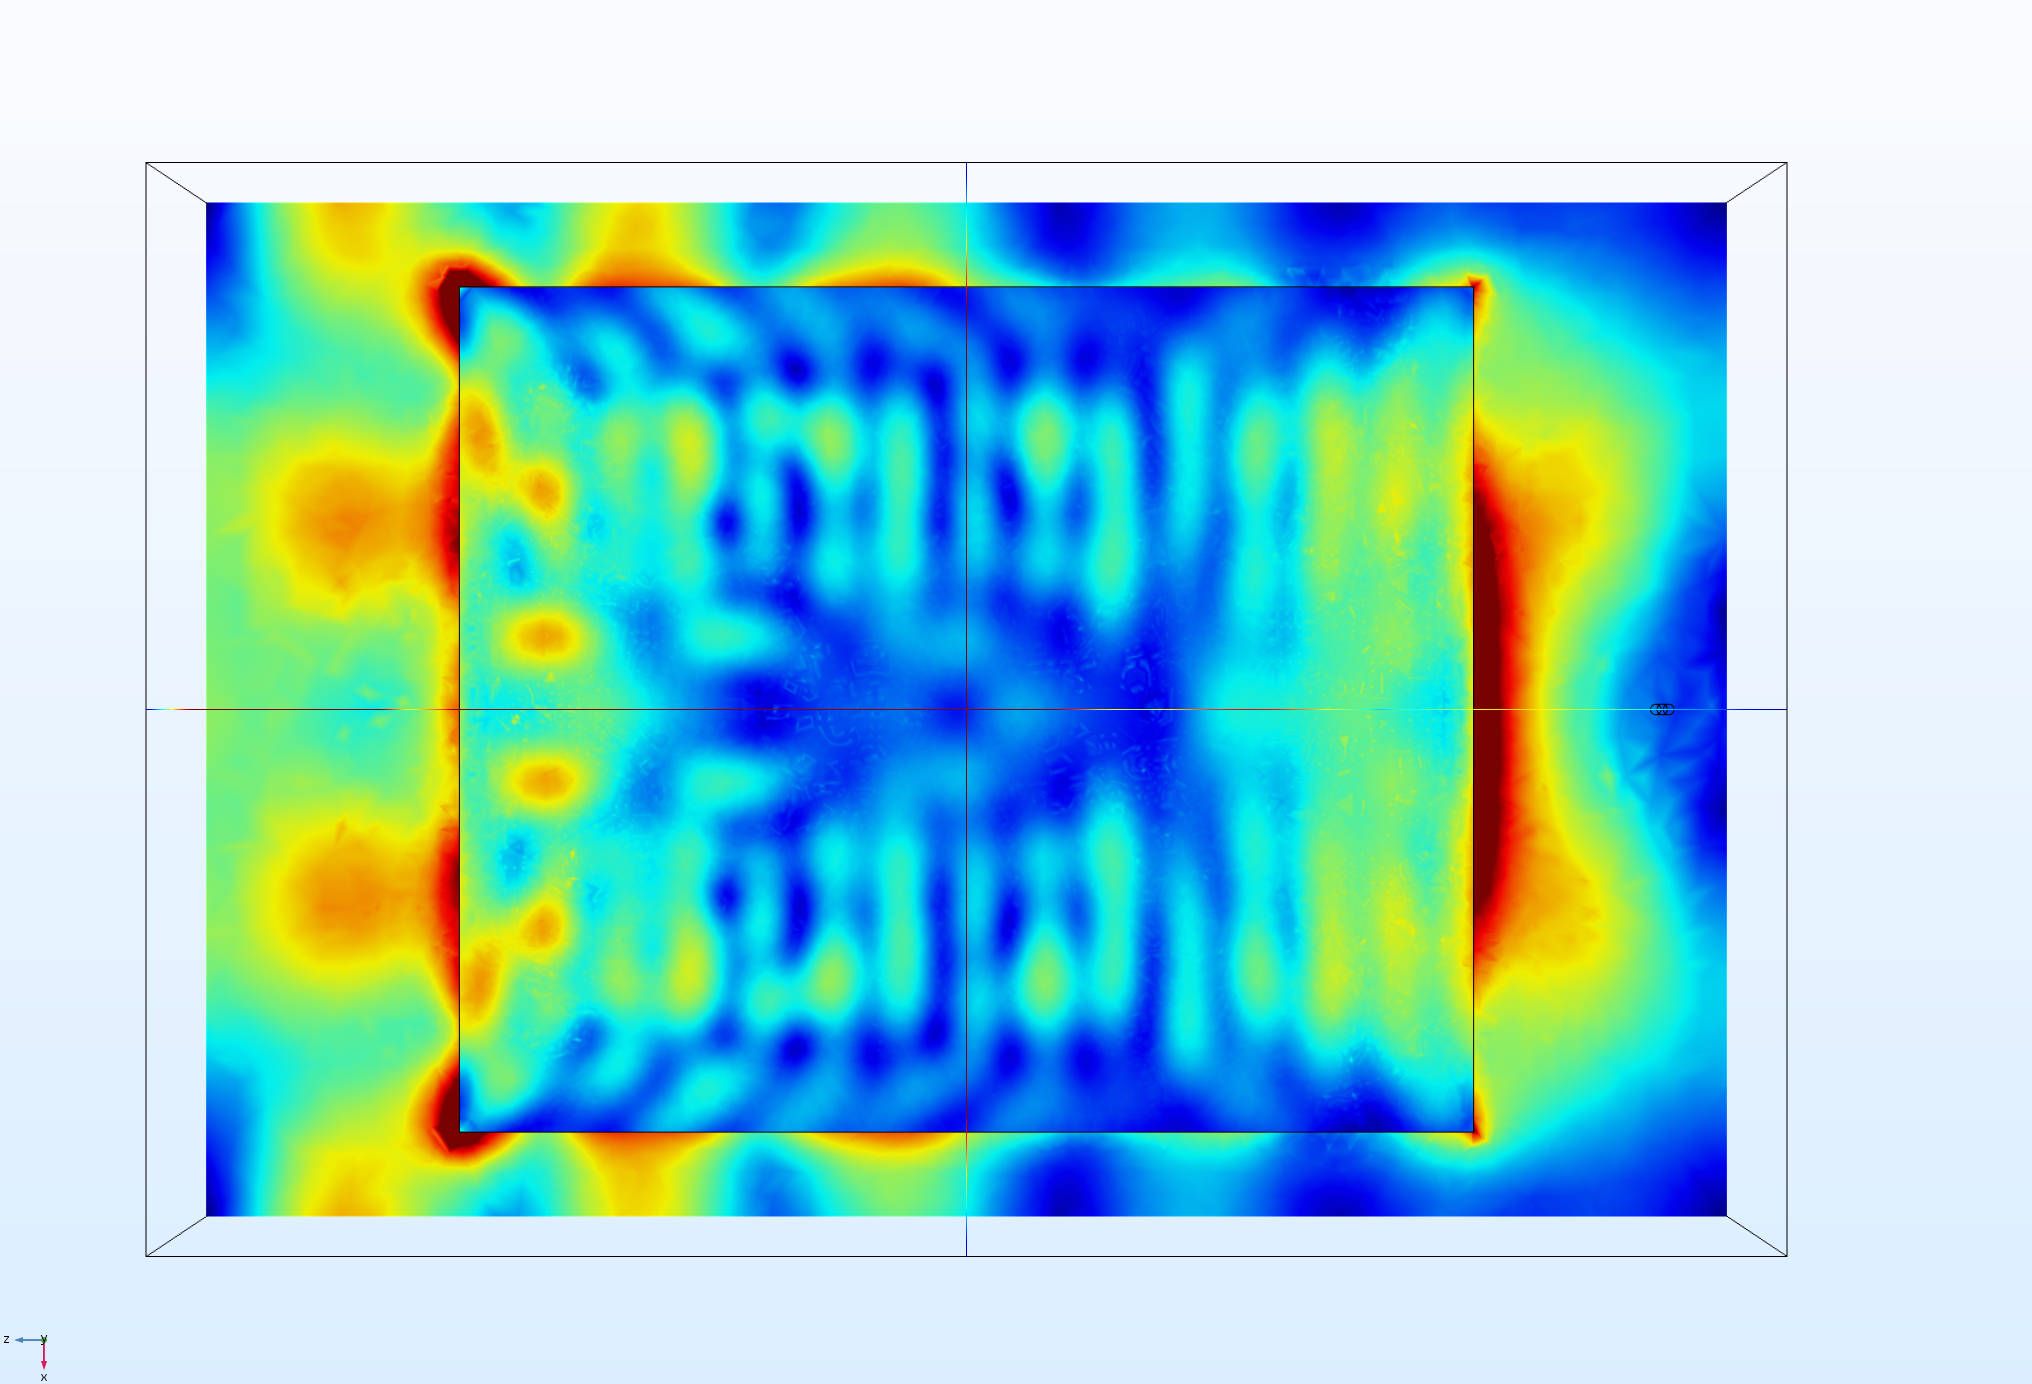
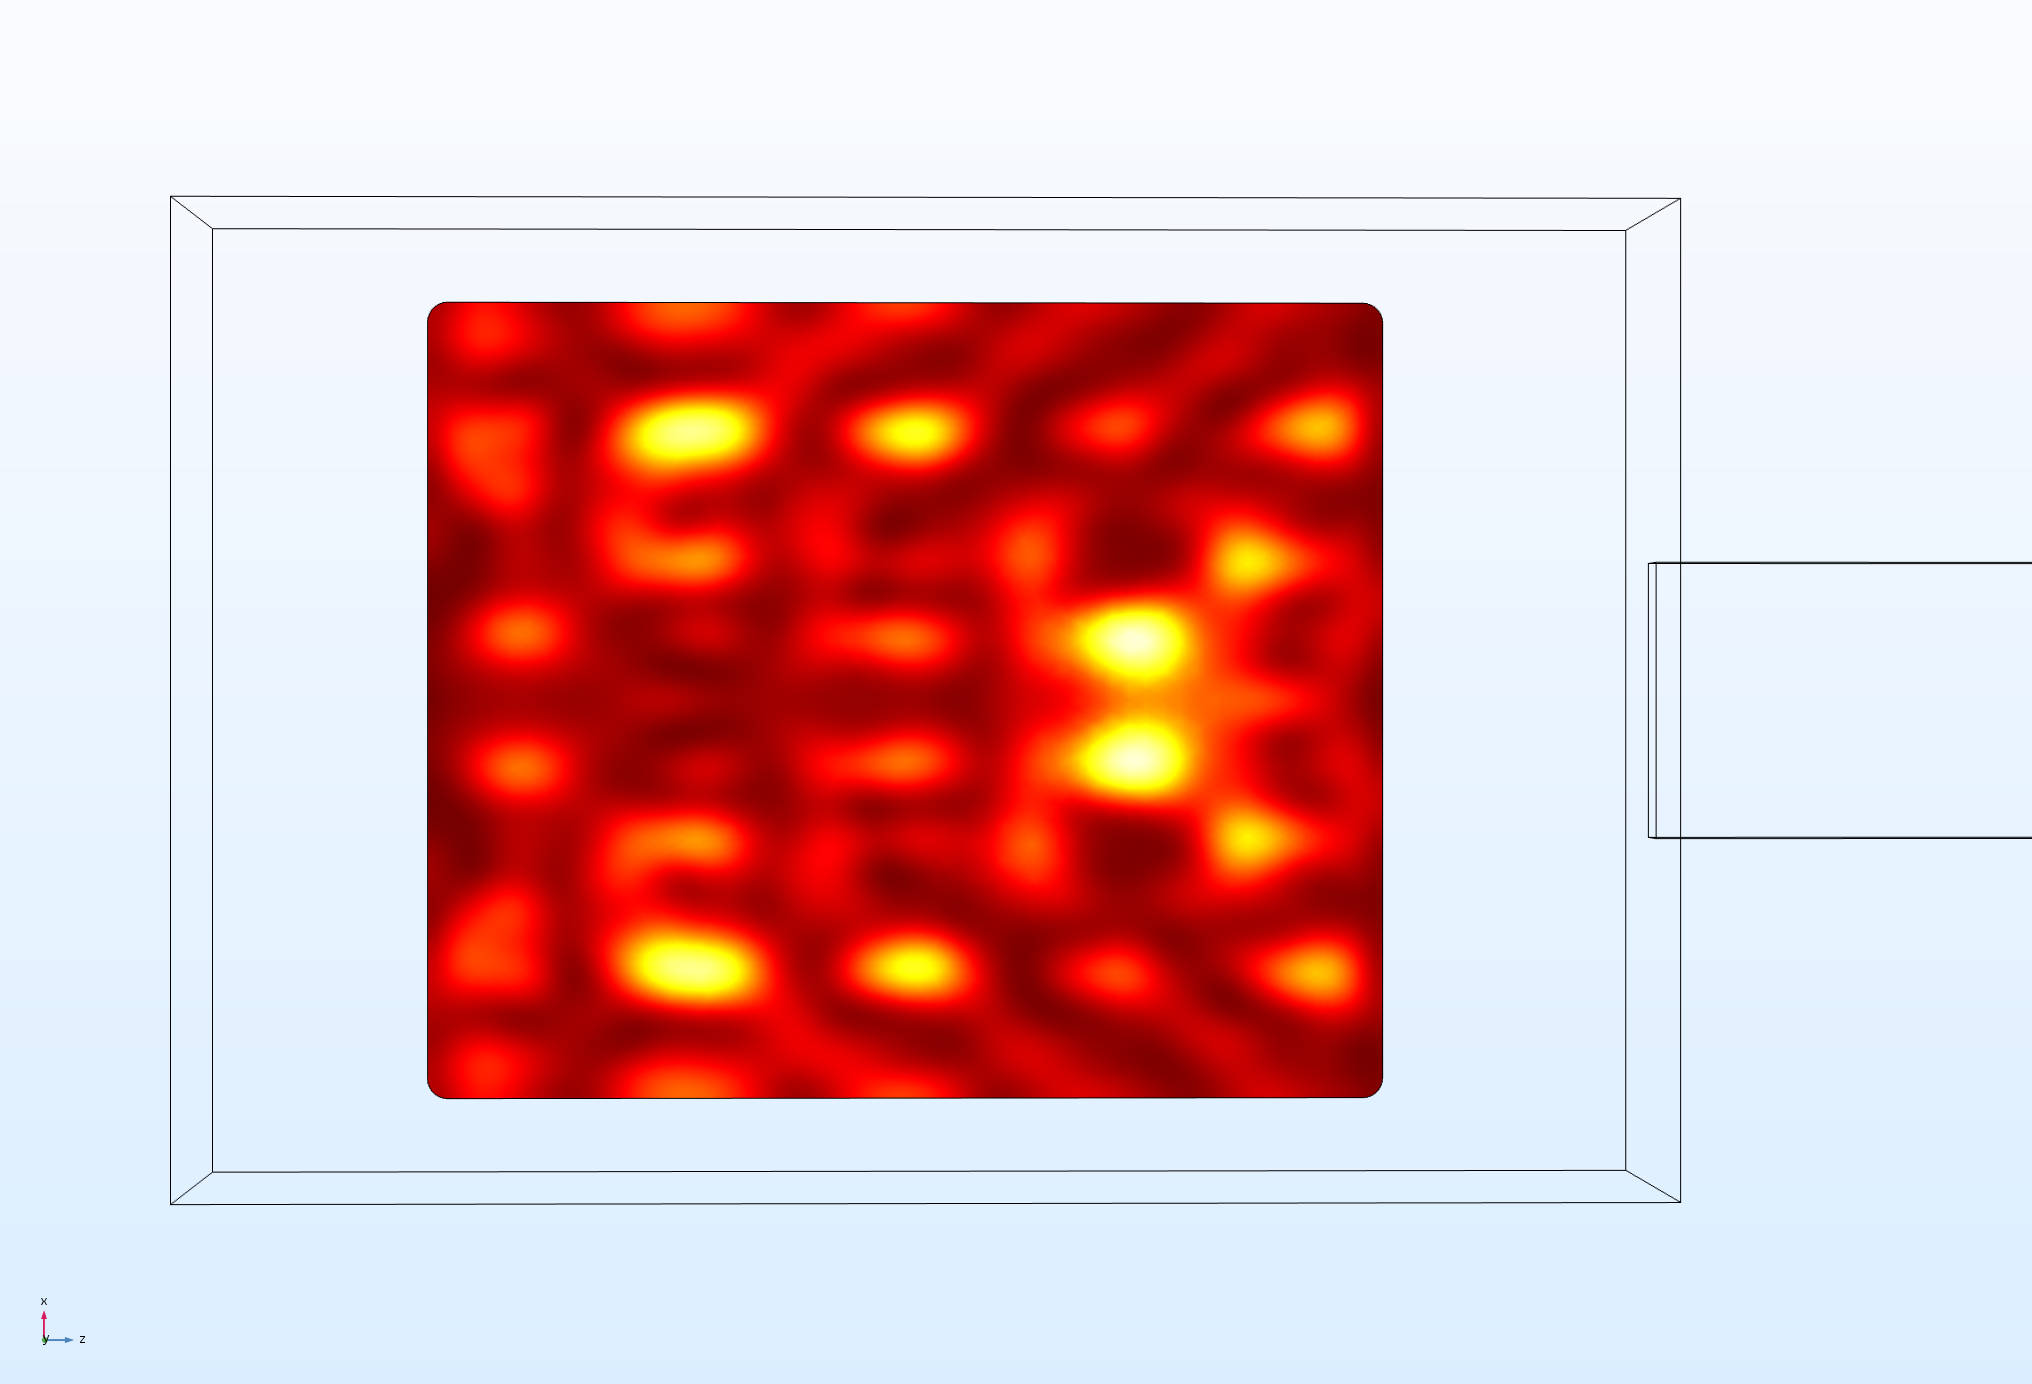
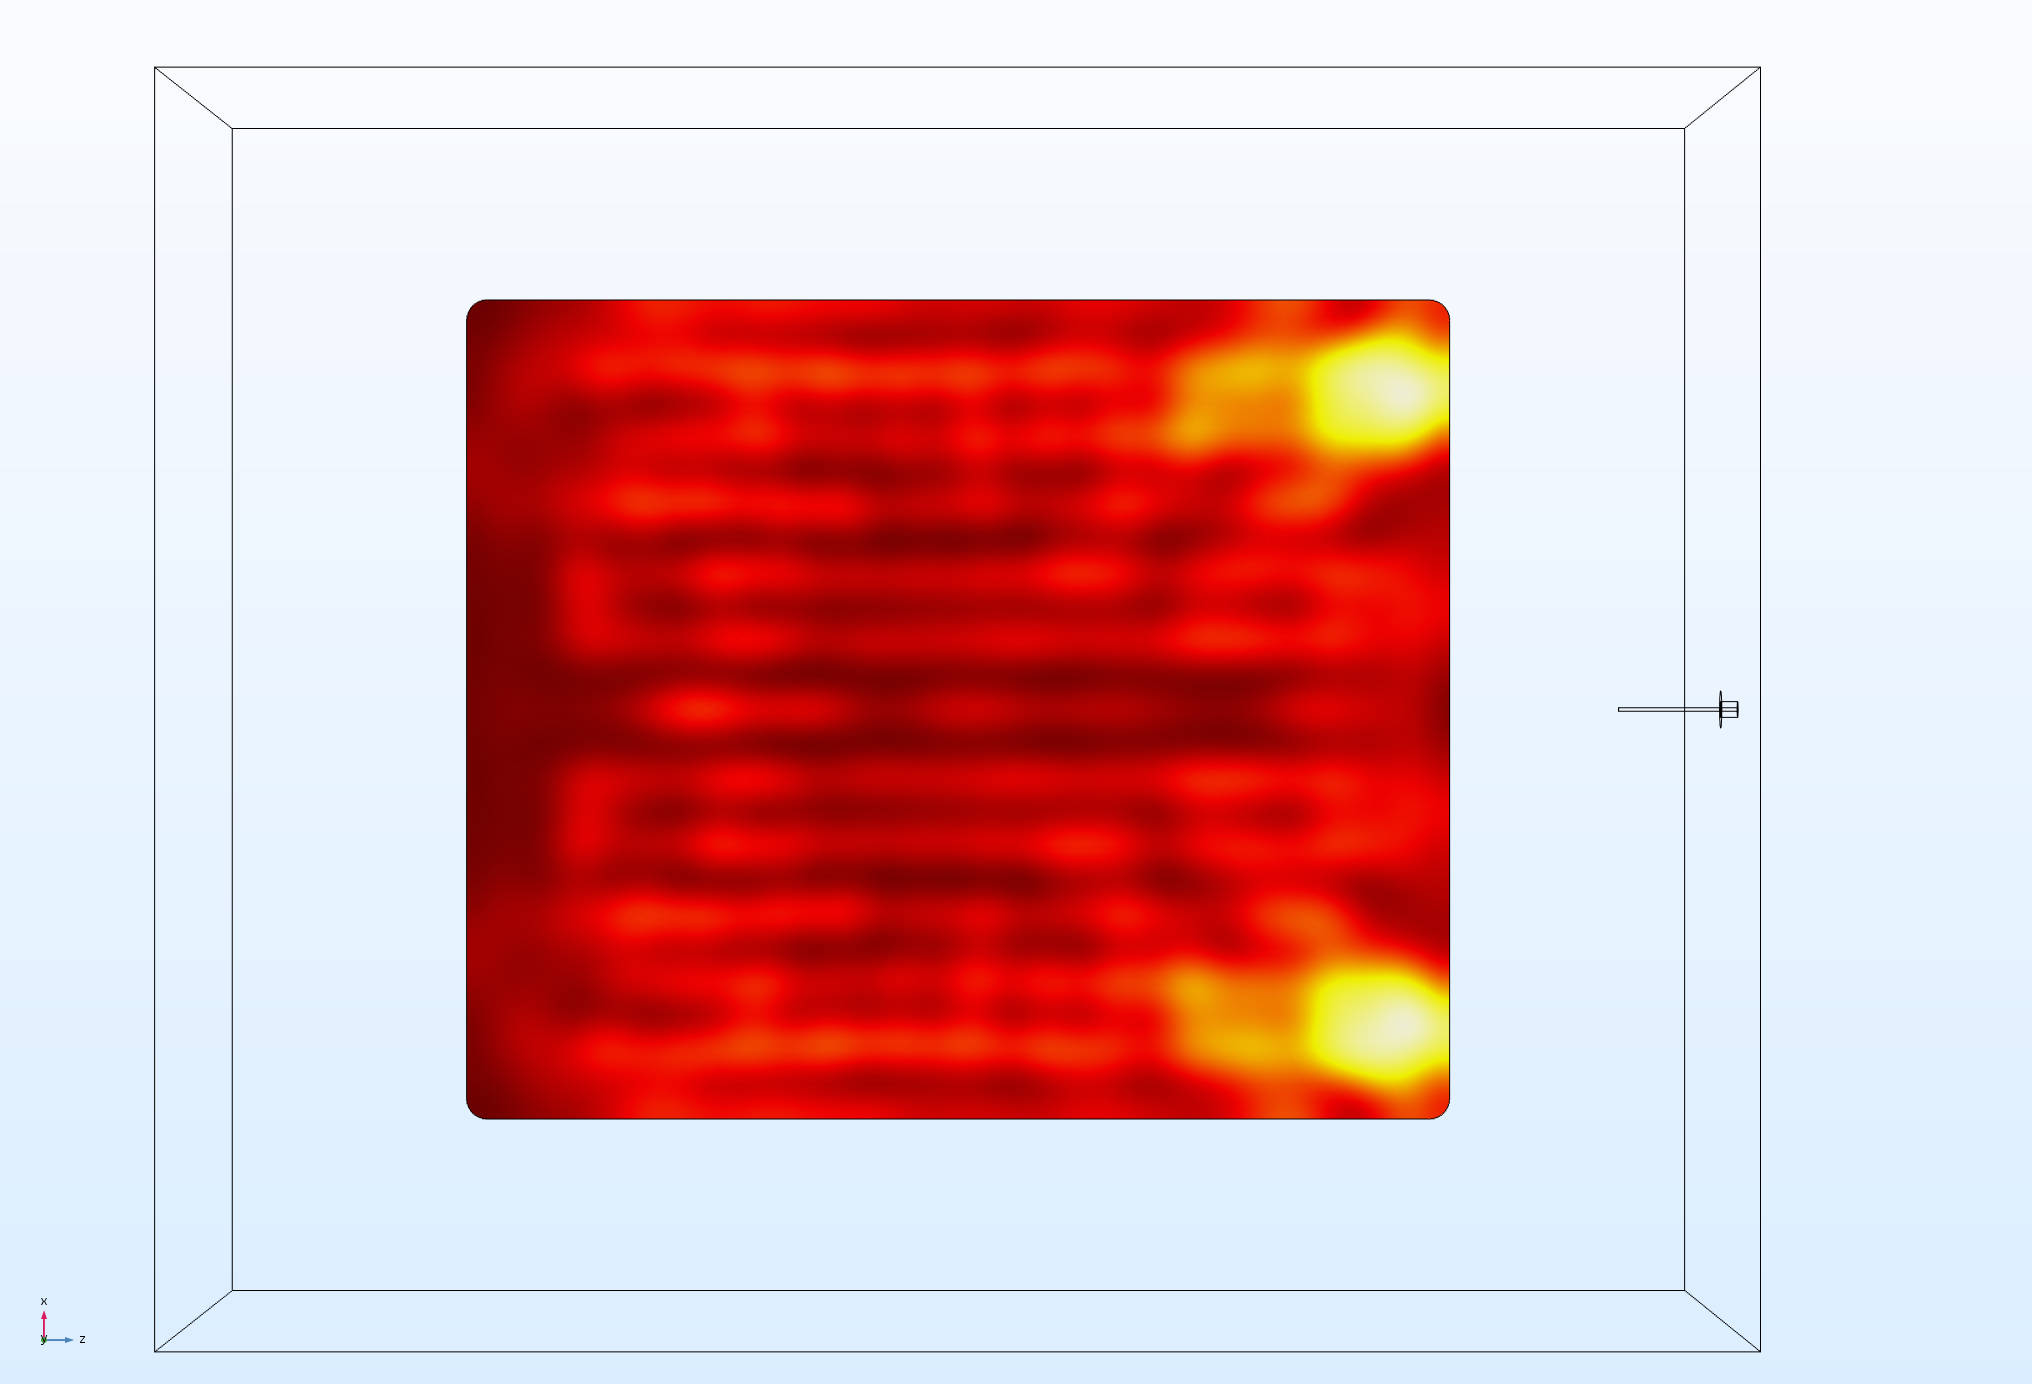
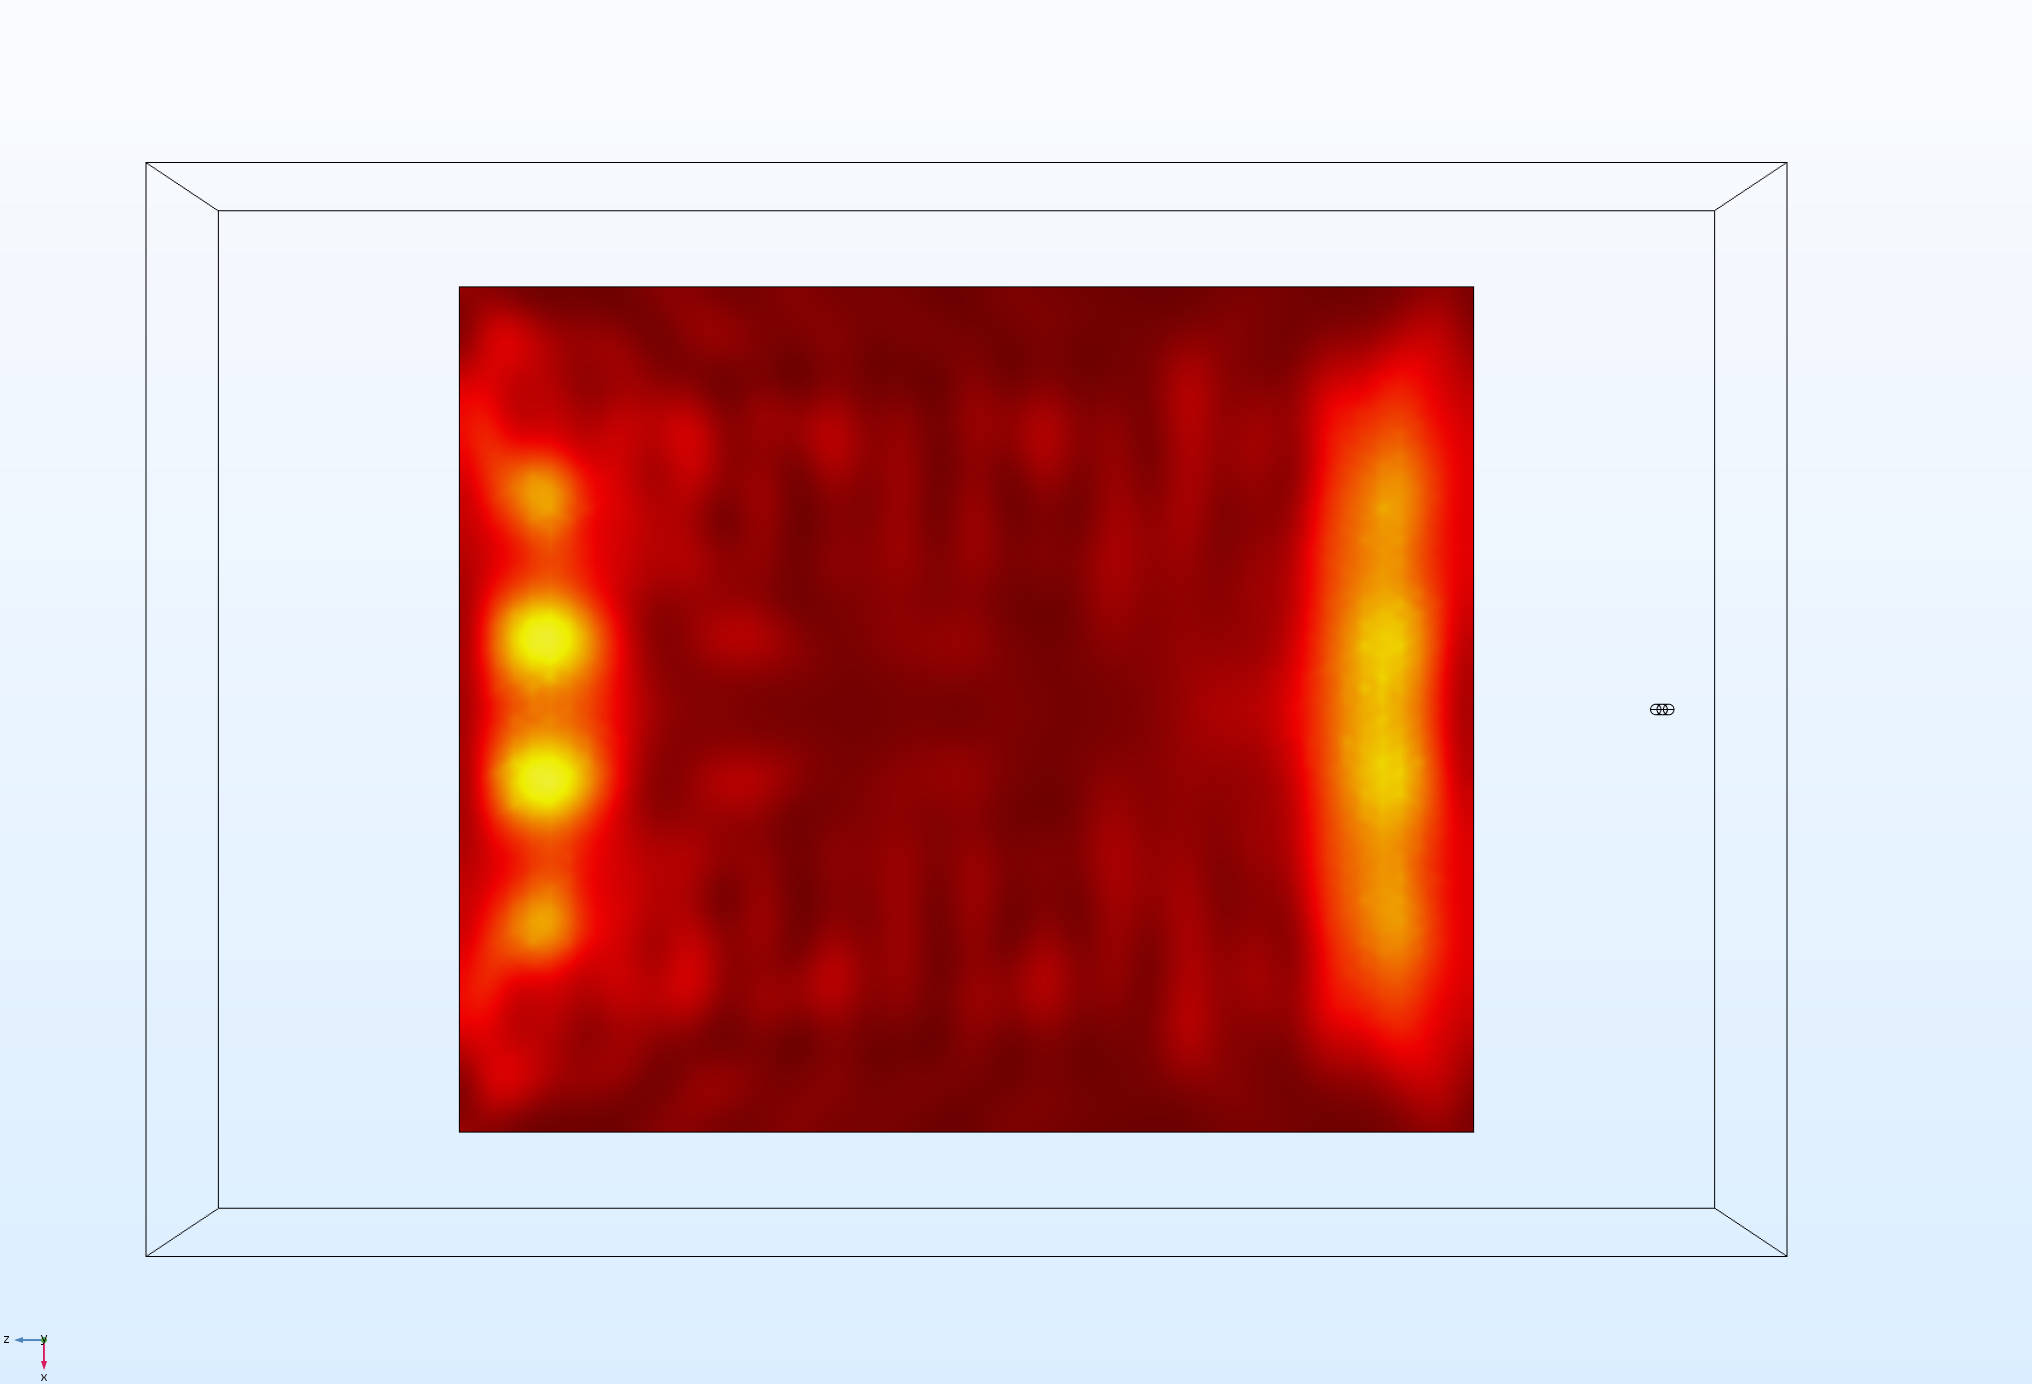
Figure 3: TOP: E-field distribution in cavity load for (left to right) WR340 waveguide, 1/4λ monopole antenna, 1/4λ dipole antenna. BOTTOM: Temperature distribution in cavity load for (left to right) WR340 waveguide, 1/4λ monopole antenna, and 1/4λ dipole antenna. Results shown are at 2.450GHz.
Apart from the visual results for the EM field and the heating profile, other important factors to consider are the scattering matrix parameters and the amount of incident power absorbed by the load. Figure 1 shows these values plotted across the frequency band for each antenna being considered, while Figure 2 displays the E-field distribution inside the cavity for each antenna. Figure 3 offers a direct comparison of the E-field power density to the heating profile of the cavity load.
CONCLUSION
The graphs in Figure 1 show a clear correlation between the amount of power absorbed by the load and the amount of power reflected back to the input, as well as indicating the bandwidth of each antenna configuration. The plots of absorbed power vs. frequency show that the waveguide feed is capable of delivering a greater percentage of the incident power to the load across a wider frequency range than either coaxially-fed antenna, despite a larger amount of reflected power across the frequency band. Analysis of the power density and heating profile from different antennas reveals vastly different patterns for each, which follows intuitively from the understanding that each antenna produces a distinct radiation pattern inside the cavity. The heating profiles also reveal varying degrees of heating uniformity between the antennas. In order to facilitate a direct comparison between antennas, each was ranked on a 3-point relative scale with 3 being the highest score, shown below in Table 1:
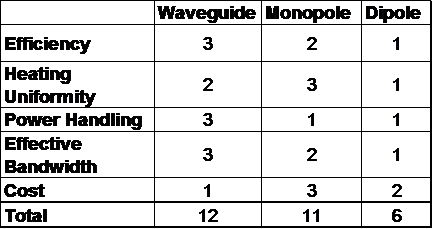
Table 1: Comparison chart of three methods of delivering microwave energy to applicator.
For this sample application, a waveguide feed appears to be most appropriate, followed closely by the monopole antenna.
REFERENCES
- Yakovlev, Vadim V., Computer Modelling in the Development of Mechanisms of Control over Microwave Heating in Solid-State Energy Systems, AMPERE Newsletter, Issue 89, pp. 18-21, 7 July 2016
- Bressan, F., et al., An Optimization Method for the Control of Efficiency in Two-Port Microwave Ovens, Conf. On Computation of Electromagnetic Fields (COMPUMAG), July 2013, Budapest, Hungary.
- Cordes, Brian G. & Yakovlev, Vadim V., Computational Tools For Synthesis of a Microwave Heating Process Resulting in the Uniform Temperature Field, Proc. 11th AMPERE Conf. Microwave & High Frequency Heating, Oradea, Romania, 3-6 Sept. 2007